Why does it exist?
Every world map you have ever seen lies about size, and the popular one, Mercator, lies the most. Greenland is drawn as big as Africa when Africa is 14 times bigger. Most people know this as a fact but have never seen the real proportions, because the honest projections look unfamiliar and nobody uses them day to day.
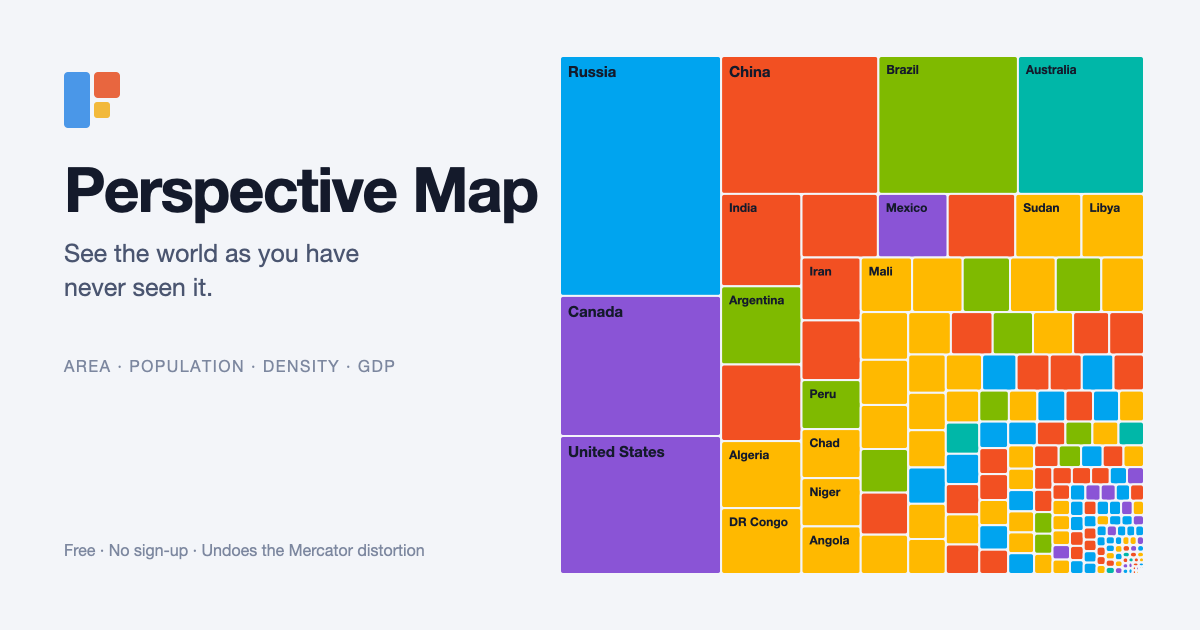
A box does not need a projection. If Africa's box has 14 times the area of Greenland's box, you can see it in a second, without knowing anything about cartography. And once countries are boxes, the same picture works for people and money, not only land. India's box is small by area and huge by population. That switch, from one perspective to another with the same countries in the same place, is the whole idea.
How does it work?
- Map view packs all 185 boxes into one rectangle with a squarified treemap, so the largest countries sit top-left and the box areas are exact.
- Atlas view places each box at the country's real location on an Equal Earth map, then nudges neighbours apart so nothing overlaps. Greenland gets a box here too. A second tab shows the same countries on the Web Mercator projection Google Maps uses, for comparison.
- List view ranks the countries with bars, for when you want the numbers.
- Show narrows the map to a continent or a group: the European Union, the GCC, South Asia, Southeast Asia, the Middle East or the African Union. A guest country can be dropped into any group to see where it would rank.
- Compare picks any set of countries and packs only those, with their share of the world and the closest country in size to each.
Where does the data come from?
| Figure | Source | Edition |
|---|---|---|
| Total area | UN Statistics Division and CIA World Factbook, total area including inland water | stable |
| Population | UN World Population Prospects, via World Bank WDI | 2025 estimates (July 2026 release) |
| GDP per capita | IMF World Economic Outlook | April 2026, projections for 2026 |
| Total GDP | IMF World Economic Outlook | April 2026, projections for 2026 |
| Density | population ÷ total area | derived |
Four countries are not covered by the IMF and use the best available figure instead: North Korea (Bank of Korea, 2024 estimate), Cuba (World Bank, 2020), Syria (World Bank, June 2025) and Eritrea (2023 estimate). Values are rounded to four significant figures. The exact edition is printed in the footer of the map and changes when we refresh.
How accurate is it?
Box area is exact to the data: a country with twice the figure gets a box with twice the area, to the pixel. The uncertainty is in the data itself. Area figures are stable and agreed. Population figures are estimates that the UN revises every two years, sometimes by a lot (Yemen's 2025 estimate rose by 20 percent in the latest revision). GDP figures for the current year are IMF projections and get revised twice a year. We show the IMF's number for 2026 because that is what most people expect when they search for a country's GDP today.
Two known gaps: twelve very small states (Antigua and Barbuda, Dominica, Grenada, Saint Kitts and Nevis, Saint Vincent and the Grenadines, Marshall Islands, Nauru, Palau, Tuvalu, Monaco, San Marino and Vatican City) are not included yet, and disputed territories such as Western Sahara are left out. Greenland appears on the atlas but not in the rankings, because it is a territory of Denmark and not a country.
What makes it different from other true-size tools?
| Perspective Map | The True Size Of | Static true-size graphics | |
|---|---|---|---|
| What you compare | boxes with exact area | country outlines you drag | a fixed picture |
| Perspectives | area, population, density, GDP per capita, total GDP | area only | area only |
| Groups | continents, EU, GCC, South Asia, Southeast Asia, Middle East, AU | no | no |
| Compare any set | yes, with rank and share of world | yes, by dragging | no |
| Data year | 2025 population, 2026 GDP | not stated | varies |
| Price | free, no account | free | free |
Questions people ask
Is Perspective Map free?
Yes. There is no account, no sign-up and no paid version. The page loads once and everything runs in your browser.
Where does the data come from?
Area: total area including inland water, from the UN Statistics Division and the CIA World Factbook. Population: 2025 estimates from the UN World Population Prospects, via the World Bank. GDP per capita and total GDP: the IMF World Economic Outlook, April 2026 edition, 2026 projections. Density is population divided by area.
How often is the data updated?
The IMF publishes new figures every April and October, and the UN population series is refreshed each July. We update the map after each release and note the edition in the footer of the map.
Which countries are included?
All 193 UN member states except twelve very small ones, plus Taiwan, Palestine and Kosovo: 185 in total, and Greenland on the atlas. The twelve not yet included are Antigua and Barbuda, Dominica, Grenada, Saint Kitts and Nevis, Saint Vincent and the Grenadines, Marshall Islands, Nauru, Palau, Tuvalu, Monaco, San Marino and Vatican City, each under 1,000 km².
Can I use the images?
Yes. Export any view with the Export image button and use it with a link back to perspectivemaps.com. The country flags are from the flag-icons project (MIT licence).
How is this different from The True Size Of?
The True Size Of lets you drag a country's outline across a Mercator map and rescales it as you go, which is a good way to feel the distortion. Perspective Map uses boxes instead of outlines, so any two countries can be compared at a glance, and it does the same for population, density and GDP, which outlines cannot show.